Tips for Building a Shareable Infographic
When designers build an infographic, their main purpose in mind is to get that infographic shared with as many people in as many places on the web as possible. That’s because infographics have value in search engine optimization (or SEO), a hot topic in the web marketing industry currently.
Infographics can be powerful link-bait for designers and their clients, but making a great, shareable piece can be difficult. These are a few tips for creating a graphic readers will want to show their friends, tweet to their followers, and post on their wall.

Less is More
This rule applies to basically every aspect of design, but it’s especially important in terms of infographics. If your infographic is more difficult to understand than just reading the statistics typed out, then you’re doin’ it wrong. The whole point of data visualization is to make the information easier to digest.
Doin’ it wrong:

Doin’ it right:

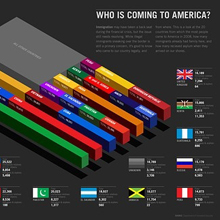
Put Things in Perspective
The best infographics are the ones that compare distant statistics to numbers that people can relate to. If all your infographic does is put a picture next to a statistic, you’re doin’ it wrong. Infographics should provide more insight than the statistics alone.
Doin’ it wrong:

Doin’ it right:

Remember, It’s an InfoGRAPHIC
I see way too many infographics that rely heavily on text to communicate. If you’re infographic looks more like a blog post than a graph, you’re doin’ it wrong. Infographics should use as little text as possible. Remember, it’s a graphic for a reason. Best practice is only to use text as a label or for further explanation, but the more your infographic can stand alone without text, the more effective and refined it will seem to readers.
Doin’ it right:

Doin’ it wrong:

Share it!
If there’s one thing that will stop an infographic from going viral, it’s not sharing it with enough people. Infographics are not going to share themselves, and the people who are likely to share it probably aren’t going to go looking for it. There are dozens of websites where you can post infographics. The more visibility you can get in the beginning, the more success you’re likely to have.
Here are a few ideas of where to share your infographic: your social media profiles (e.g. Facebook, Twitter, Google+, LinkedIn, Tumblr), your blog, social link-sharing sites (e.g. Digg, Reddit) or infographic blogs (e.g. Cool Infographics, Visual.ly).

Just Do It
The most important part of making a successful infographic is just getting started. If you follow these guidelines, you’ll be off to a good start. The more you make, the better you’ll get and the more success you’ll have.
No disrespect but your internet troll example isn’t meant to be an infographic anyways. you should also remember to use infographics when giving examples of infographics.
Outstanding infographics. Love to see such an interactive and detailed infographics which i never let it go. Bookmarked it to share it with others. Thanks